
← Our Tools · 3 of 5
Our tools
Power BI
Reporting is only as good as what it's built on. We use Power BI to turn scattered spreadsheets and disconnected systems into a single, trustworthy view of how the business is actually performing.
← Our Tools · 3 of 5
Our tools
Reporting is only as good as what it's built on. We use Power BI to turn scattered spreadsheets and disconnected systems into a single, trustworthy view of how the business is actually performing.
Power BI is Microsoft's business analytics platform - dashboards and reports connected live to your underlying data sources. On its own, it's just a chart-building tool; the value comes from what it's built on top of.
Before we build a dashboard, we make sure the data underneath it is consolidated, trustworthy and structured properly. Otherwise you just get a good-looking version of the wrong answer.
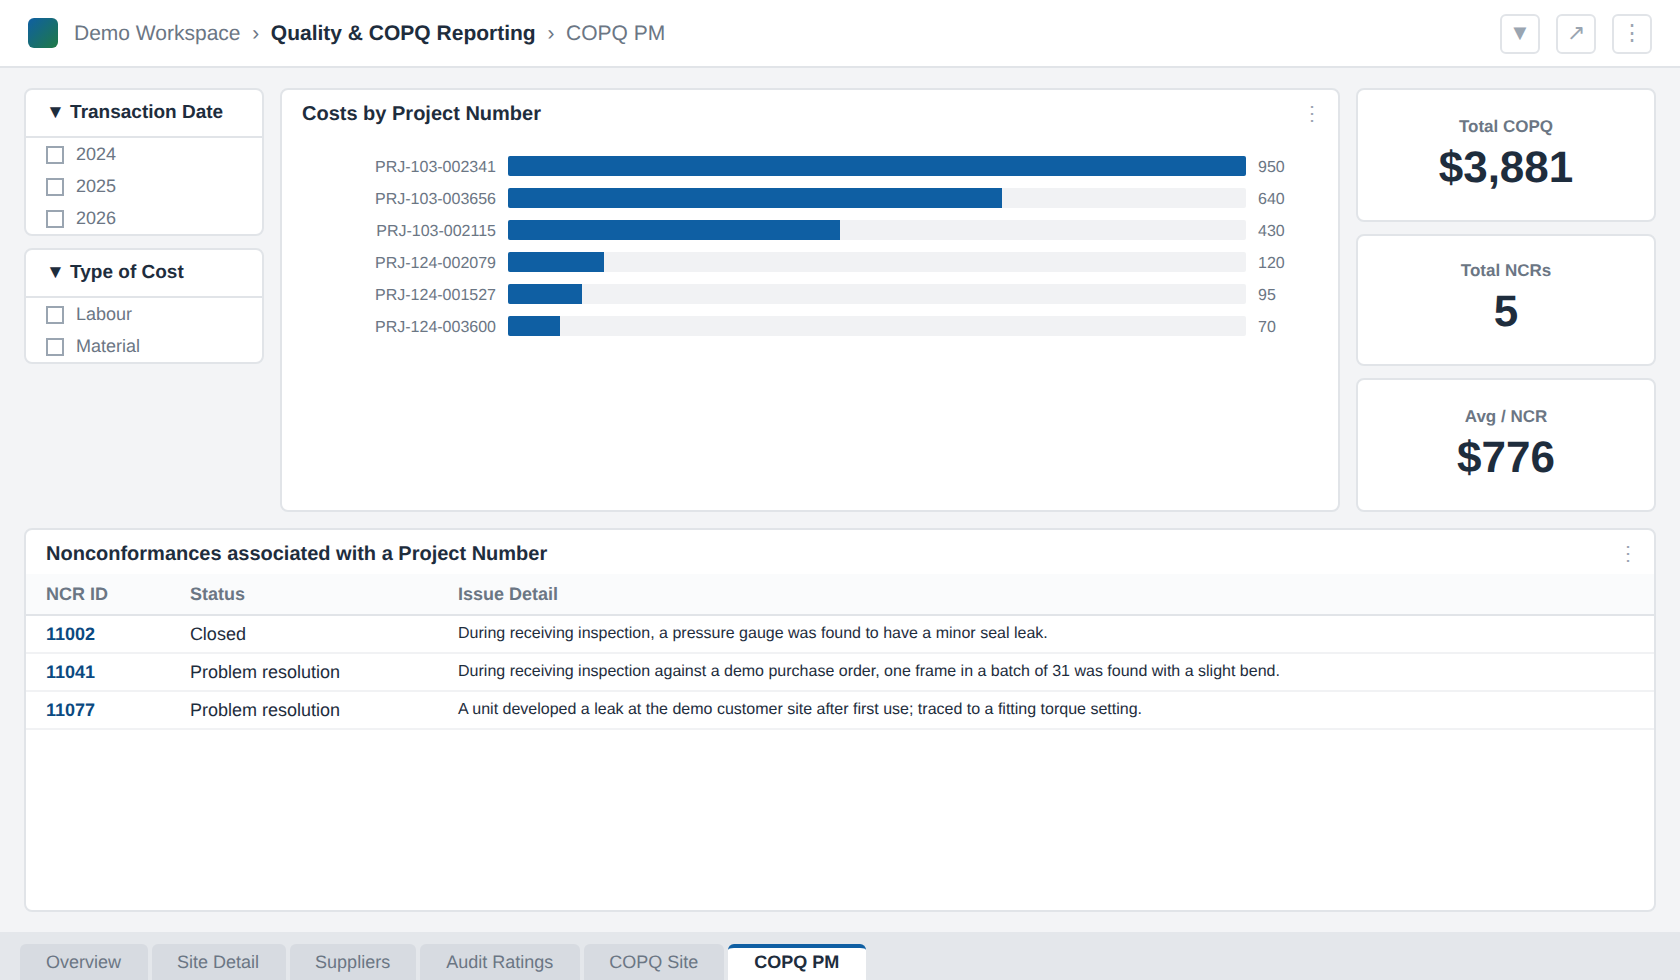
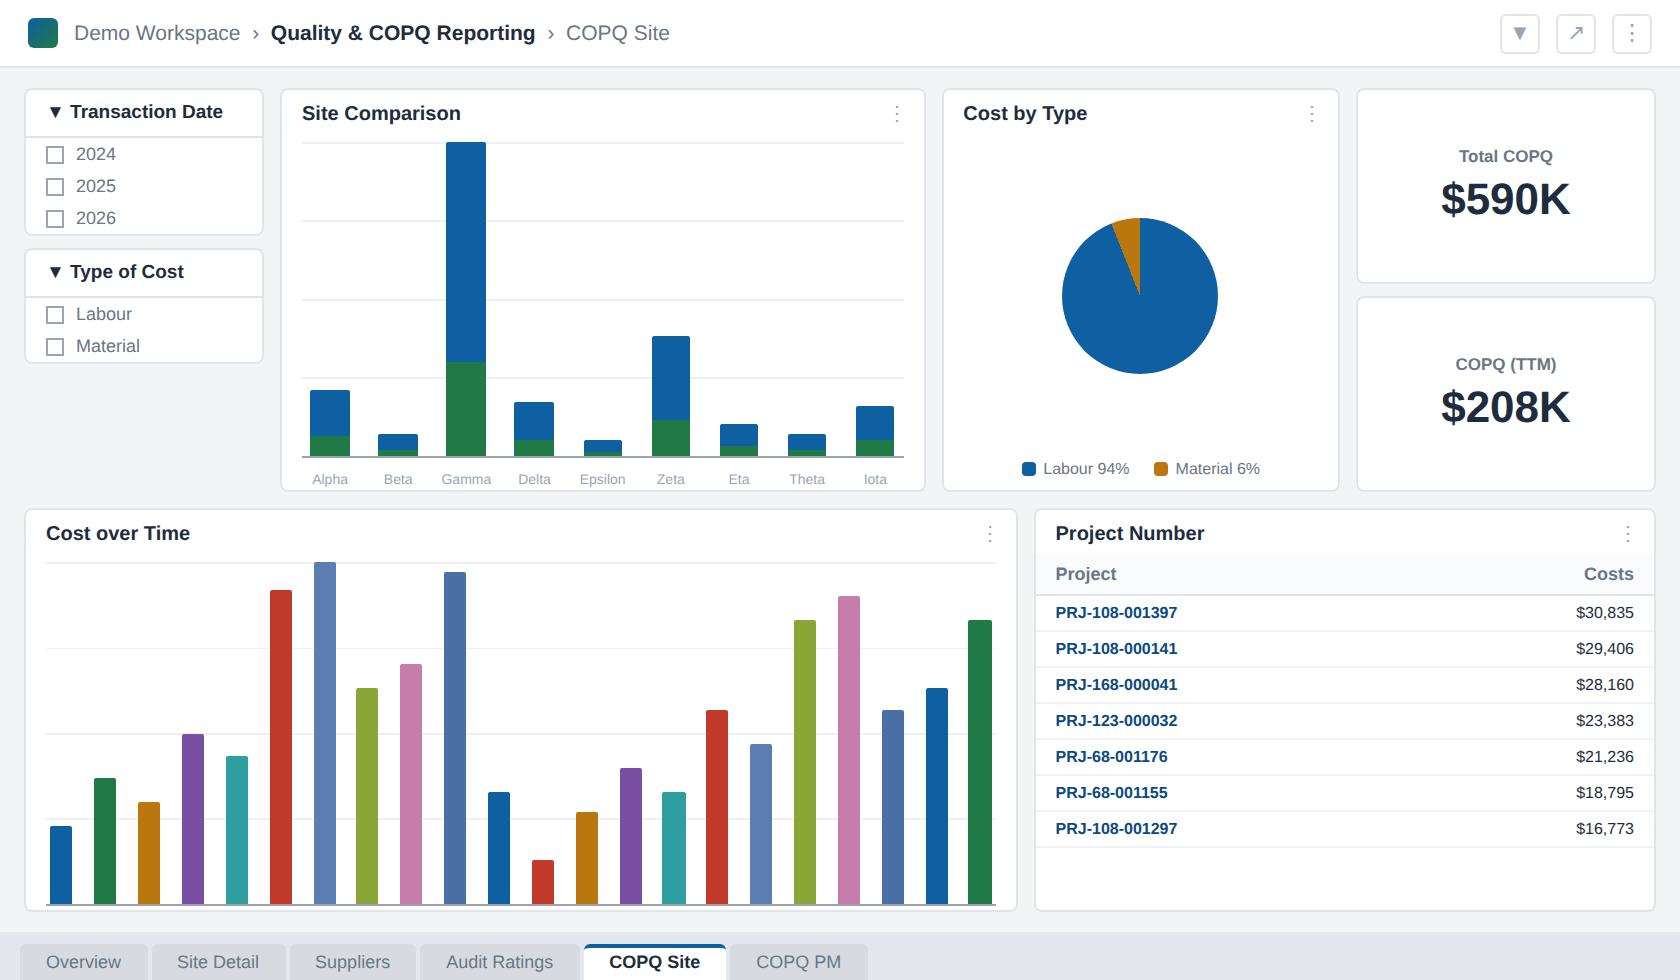
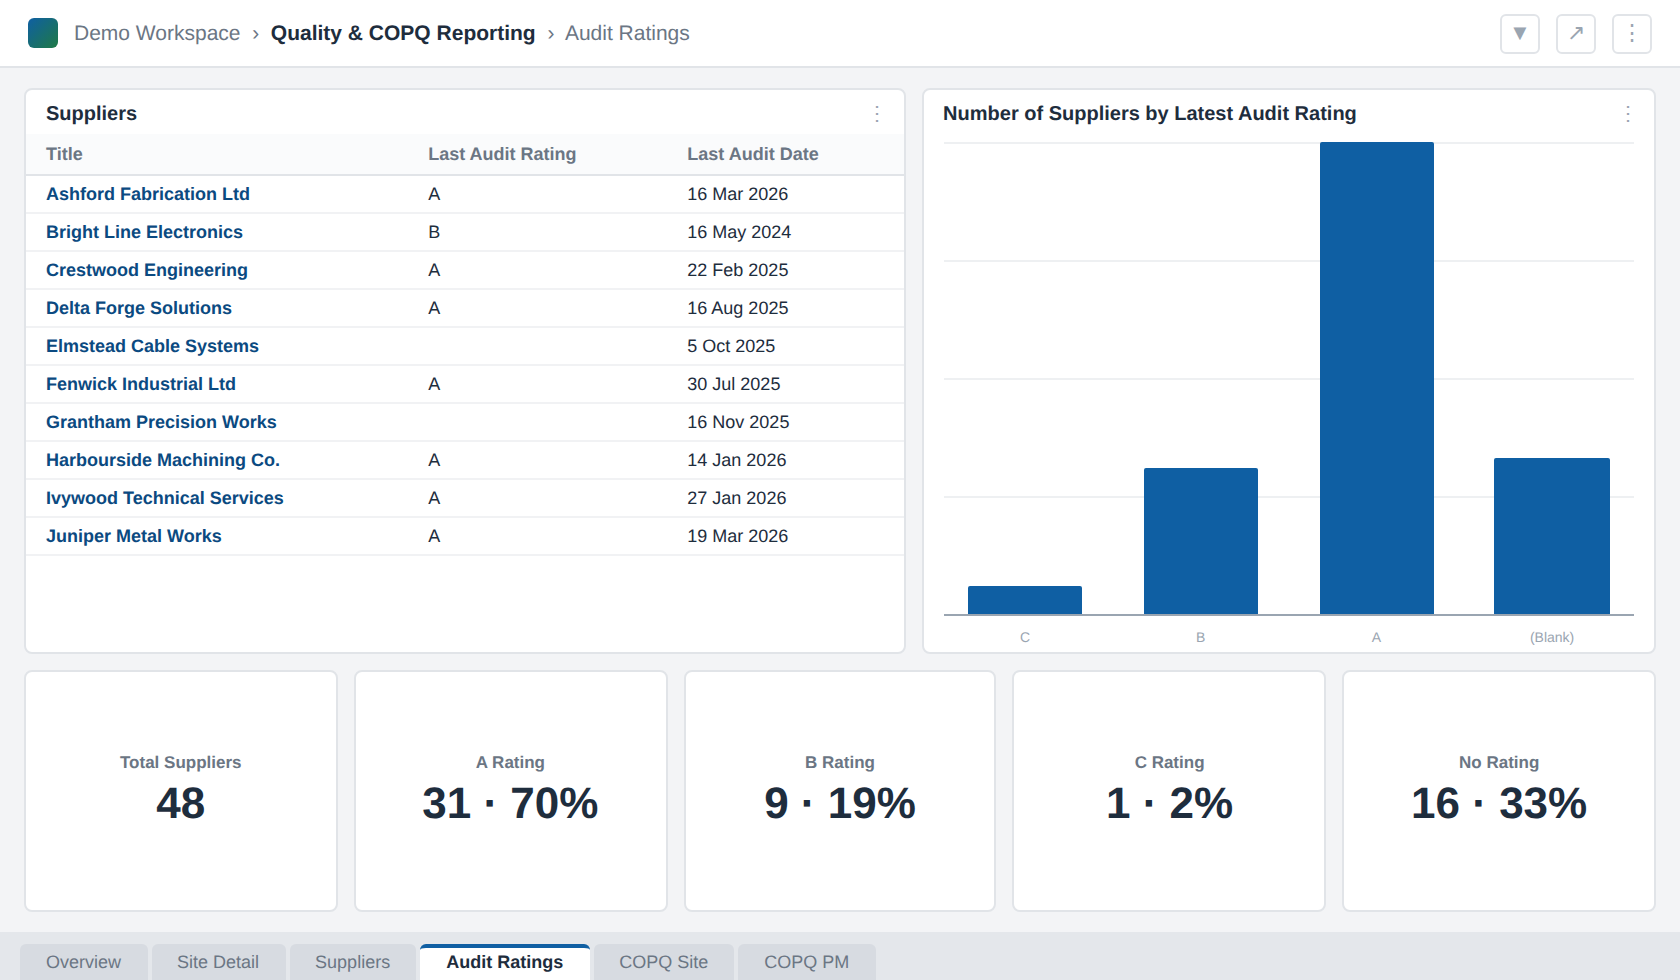
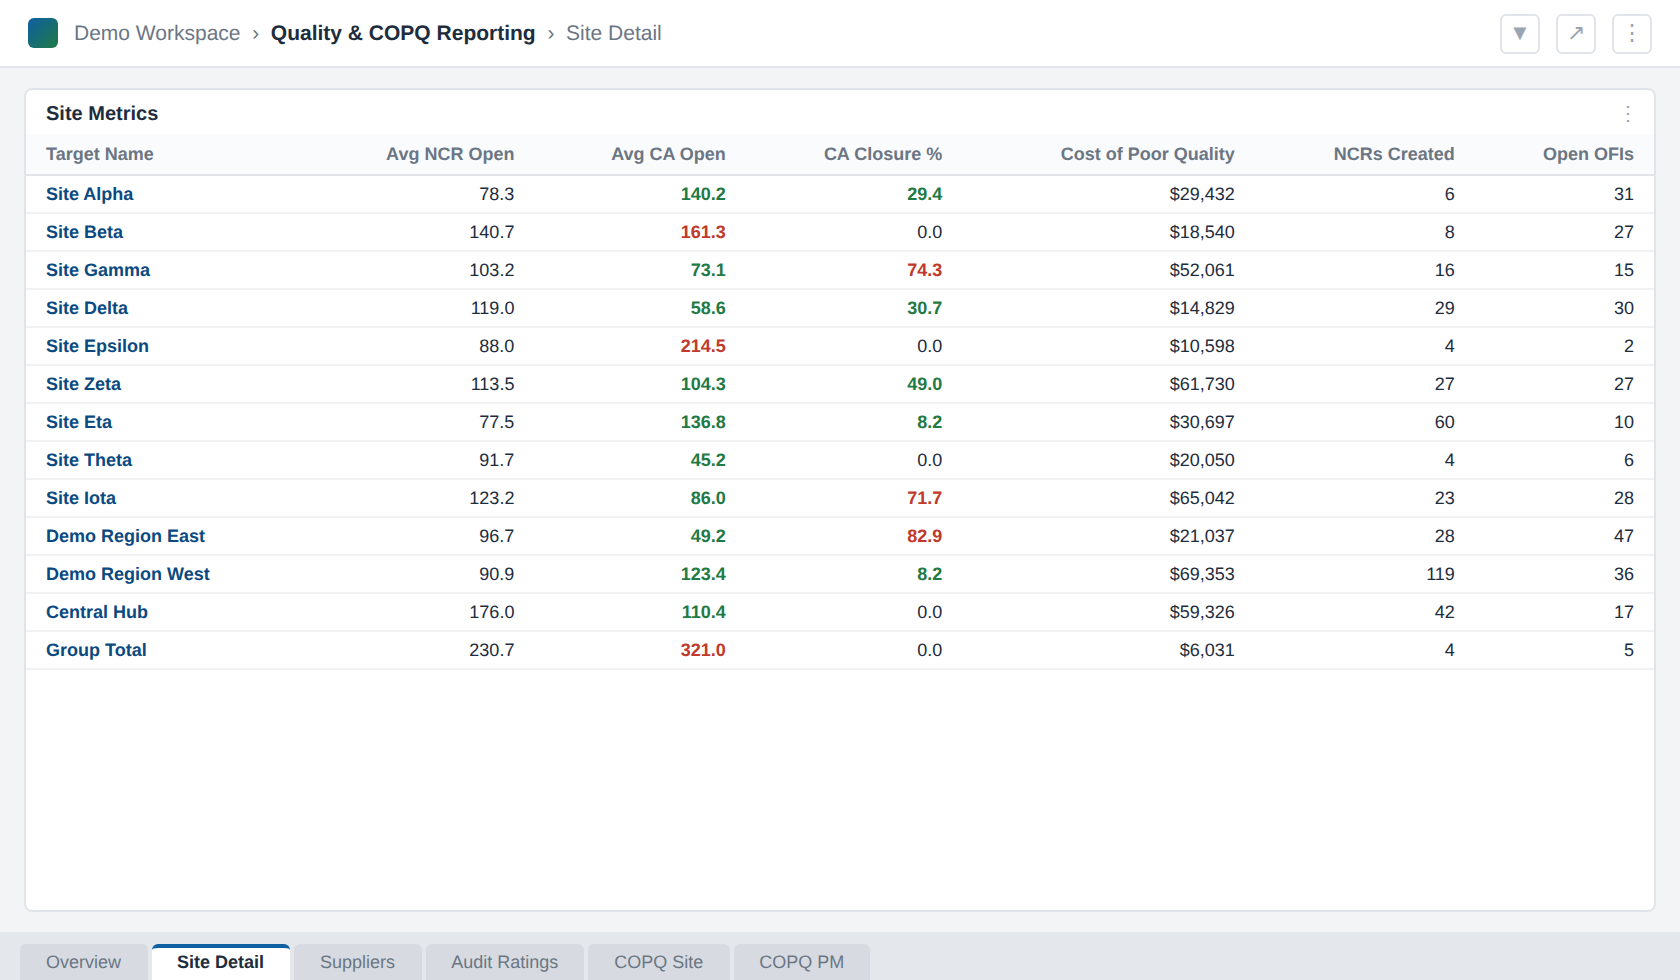
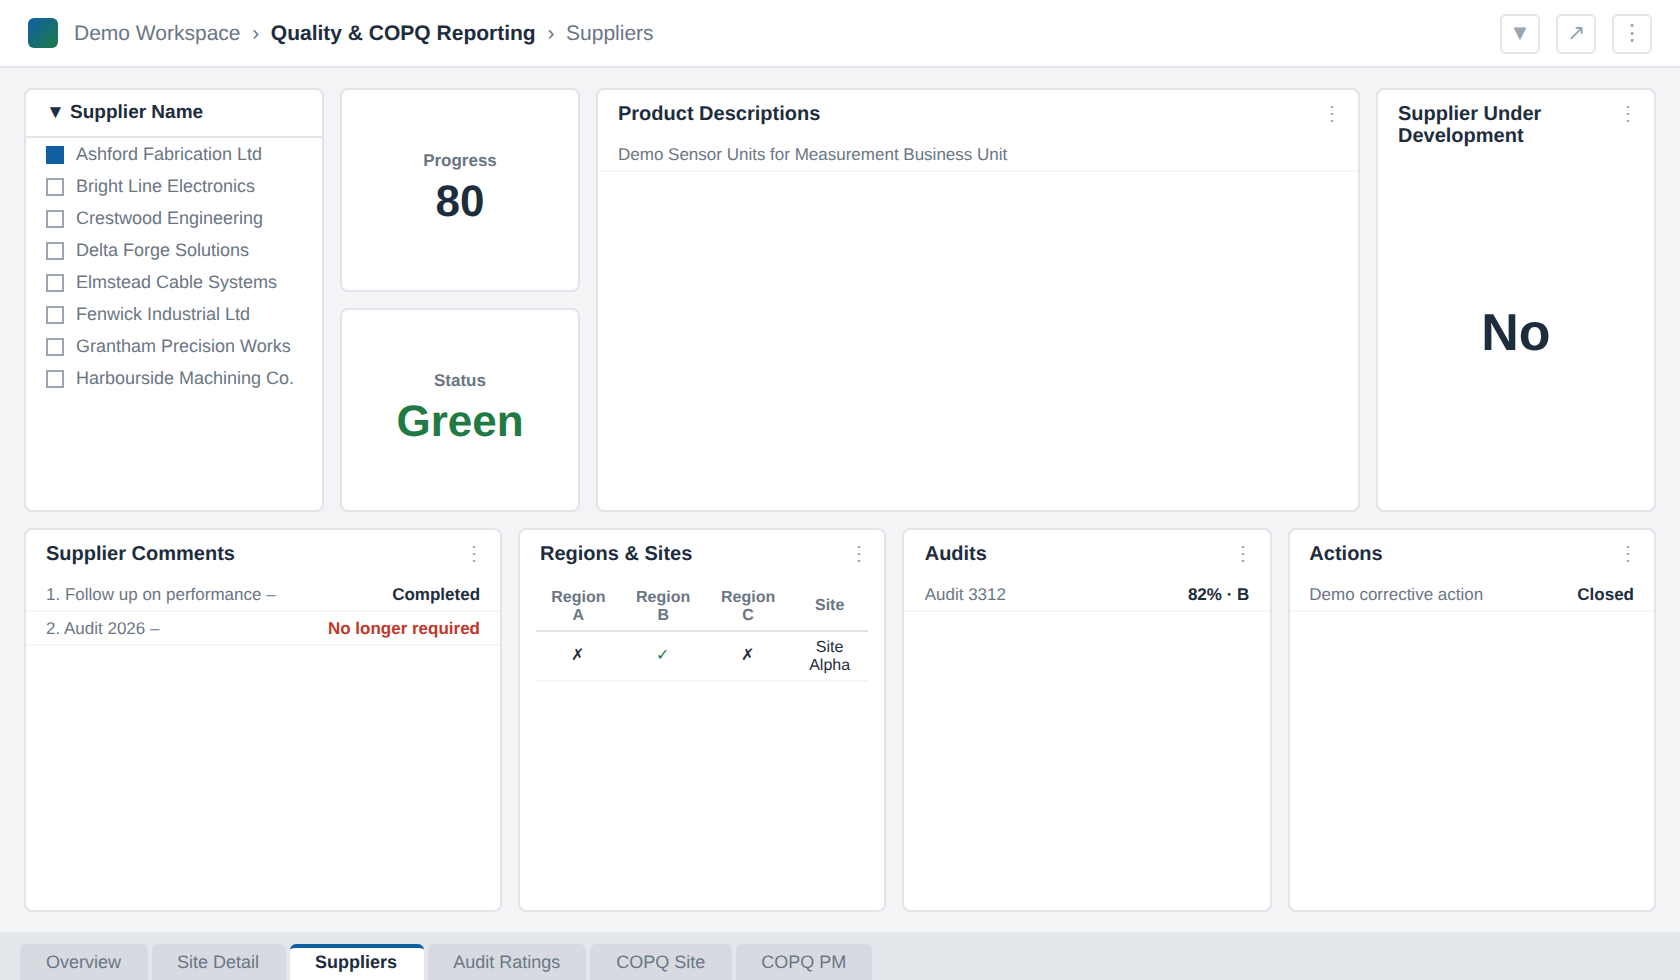
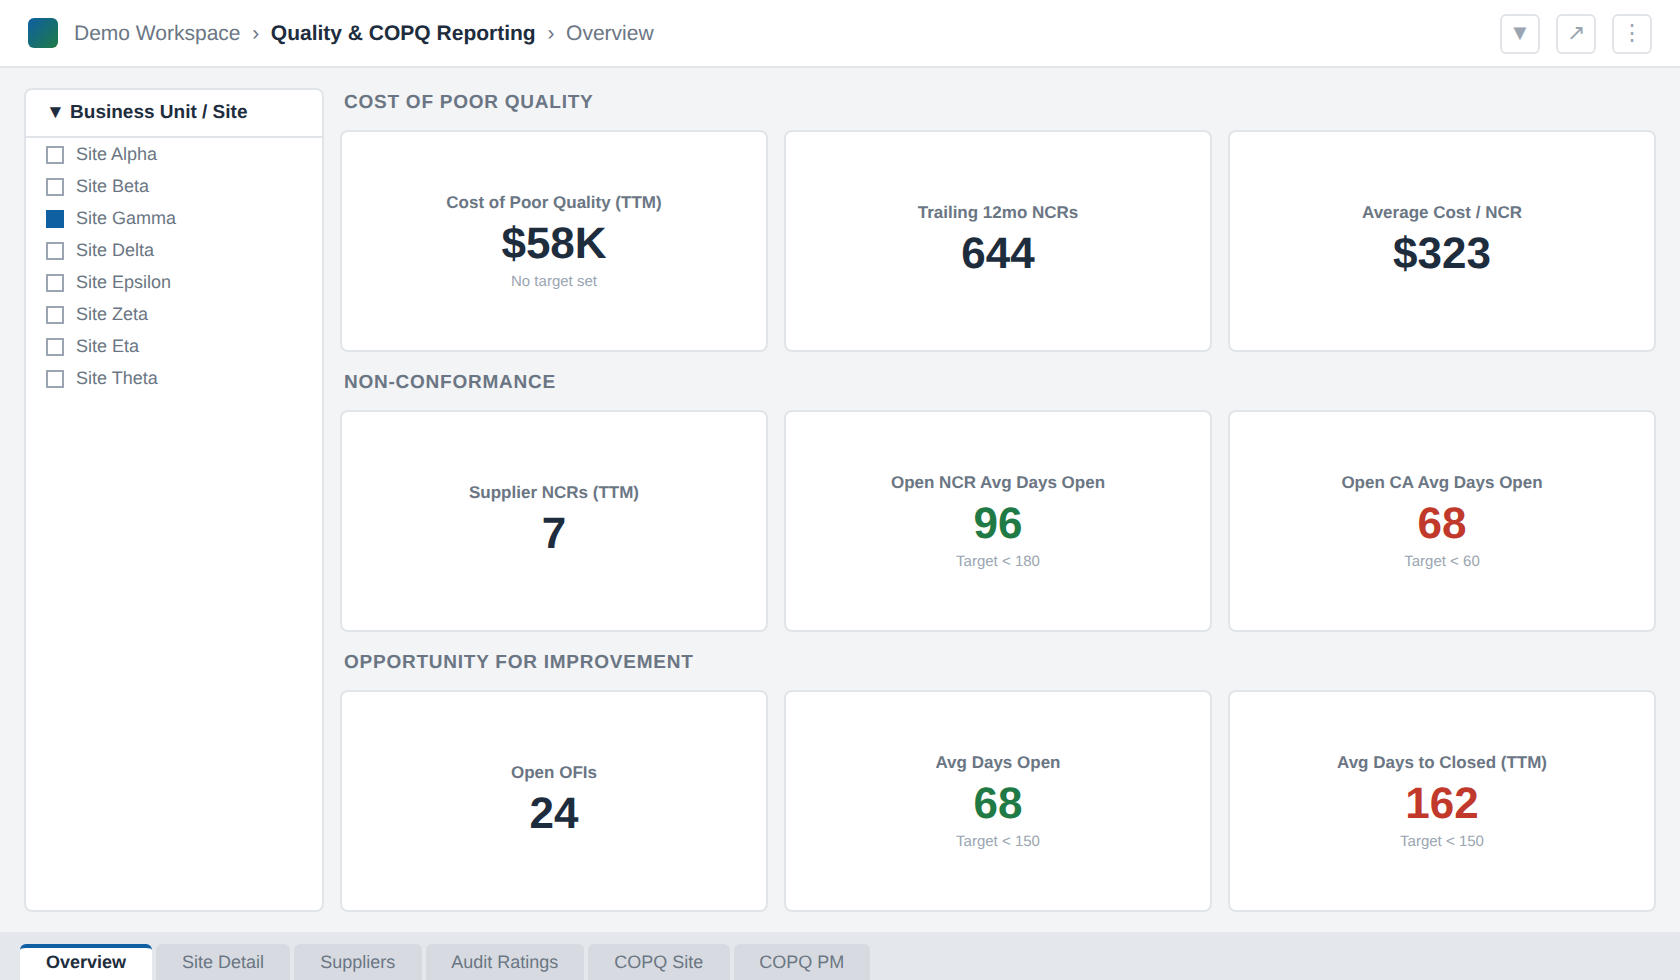
Screenshots from work we've delivered - more added as projects go live.
Tell us about your organisation and what you're trying to improve. It helps us tailor our response to what actually matters to you.
Take the Survey →